If you have ever shopped for a car, then you have probably considered the fuel economy ratings of your options – especially since gas prices seem to always be going up. On the surface, they seem pretty simple. There is this nice big sticker in the window stating exactly how many MPG the car gets in city driving, highway driving, and combined. The sticker will even tell you how much fuel will cost you annually and how that compares to the average vehicle. But where do these numbers come from? And what is that big informative sticker hiding?
To begin with, determining fuel economy figures for cars sold in the United States is done by the Environmental Protection Agency (EPA), a task it has performed since 1974. However, the majority of the testing is actually performed by the manufacturers themselves, with the EPA only testing around 15-20% of the models sold. Further, manufacturers are only required to test a single vehicle for each required category, and that vehicle is usually a pre-production prototype rather than a production model. This introduces a lot more variability into the numbers than you might imagine, with models often having different official fuel economy figures from year to year despite having no powertrain changes.
Some vehicles are also exempt from fuel economy testing. This includes trucks and cargo vans with a Gross Vehicle Weight Rating (GVWR) of over 8,500 pounds and all other vehicles with a GVWR of over 10,000 pounds (up until 2011, it was simply all vehicles over 8,500 pounds). This means that you will never see official fuel economy ratings for heavy-duty trucks or particularly large SUVs. Motorcycles are also exempt from fuel economy ratings.

The Test
The window sticker that we are all familiar with has three bold numbers: City MPG, Highway MPG, and Combined MPG. But what do those simple labels actually mean? It is a bit more complicated than you might think. The fuel economy test is actually several separate tests (known as “cycles”) that are combined to produce the numbers you see. All testing is conducted in controlled laboratory conditions, with a stationary vehicle strapped to a dynamometer that allows the wheels to spin. Interestingly, the testing does not directly measure fuel consumption but measures the exhaust emissions and uses that to calculate the fuel burned.
The City Cycle
When fuel economy testing began in 1972, there was only the City cycle. Designed to replicate an LA rush hour commute, this test was not very representative of the majority of driving and has only become more outdated over time. However, it is still in use today. The City cycle lasts for 1,874 seconds (31.2 minutes) and covers a simulated drive lasting 11 miles. There are 23 stops in the drive, with 18% of the time spent idling, and it has an average speed of just 21 mph. The top speed is 56 mph (achieved twice in the test), and maximum acceleration is equivalent to an 18-second 0-60 time. Unless you live in a densely populated city, this cycle will likely have very little relevance to your driving.
The Highway Cycle
The Highway cycle arrived a few years later in 1978 and has also not been updated in the ensuing five decades. This means that the Highway cycle still reflects the 55 mph national speed limit that has not been in effect since 1995 and has a top speed of 60 mph. The average speed is a shockingly low 48 mph. The total cycle lasts 765 seconds and covers a 10-mile simulated drive beginning with a warmed-up engine. Once the cycle begins, speeds are kept fairly constant, only dipping below 30 mph a single time. For most people who do not drive in a heavily urban environment, the Highway cycle will be the closest approximation to real-world driving.
Combined MPG
Combined fuel economy is not actually a test but rather a combination of the city and highway fuel economy numbers. But rather than being a simple average, it is a weighted average that leans 55% city and 45% highway. This heavy tilt towards the City cycle means that combined fuel economy best represents the suburban driver making trips into the city rather than a reflection of real-world city and highway traffic.
The Five-Cycle Test
Up until 2008, that was it for testing. However, as highway speeds continued to increase (the fastest highway in the United States now has an 85 mph speed limit – and we all know how few people actually drive the speed limit) and car acceleration continued to improve, it was becoming rather clear that the two-cycle test was horribly obsolete. In fact, starting in 1984, the EPA simply reduced all city test results by 10% and all highway results by 22% in a decided unscientific attempt to compensate. It wasn’t until 2008 that the modern “five-cycle” test was introduced – and its use wasn’t actually mandated until 2012.
- The High Speed cycle attempts to better reflect modern highway speeds, reaching a top speed of 80 mph and requiring acceleration equivalent to a 7-second 0-60 time. However, it is not a true highway test as it has an average speed of 48 mph, includes 5 stops, and spends 7% of the 596-second test at idle.
- The Air Conditioning cycle measures the effect of air conditioning on fuel economy. While the previous three cycles are measured at temperatures of 68-88º with all climate control off, this test is conducted at 95º with the air conditioning on. The test itself is very close to the city test, with a top speed of 55 mph, an average speed of 21 mph, and 5 stops, with 19% of the test spent at idle. However, the test lasts for 596 seconds and covers a distance of under 4 miles.
- The Cold Temperature cycle is the opposite of the Air Conditioning cycle and is conducted at a temperature of 20º with the heater on. While the top speed of 56 mph, average speed of 21 mph, and 18% of the time spent at idle are also rather similar, the other details are fairly different. The Cold Temperature cycle lasts for 1,874 seconds, starts with a cold engine, and requires 23 stops.
Testing Drive Modes and Shifting
One of the many ways that fuel economy testing has had to keep up with automotive technology is how it handles different drive modes and other advanced features. All EPA testing is conducted in whatever mode the vehicle defaults to when you turn it on. If a driver can choose to have a car turn on in a chosen mode, the EPA will average the results of the different modes unless the manufacturer can prove that drivers overwhelmingly use a particular mode. Incidentally, this is why many modern cars will default to the most efficient mode even if drivers dislike it.
When it comes to testing manual transmissions, things get complicated. Until 1976, all manuals were shifted at 15, 25, and 40 mph. After 1976, manufacturers were allowed to recommend shift points, which were, of course, designed to maximize fuel efficiency. In order to prevent unrealistic shift points from being used, the test administrator may choose to use shift points other than what the manufacturer recommends.

Testing Hybrids and Electric Vehicles
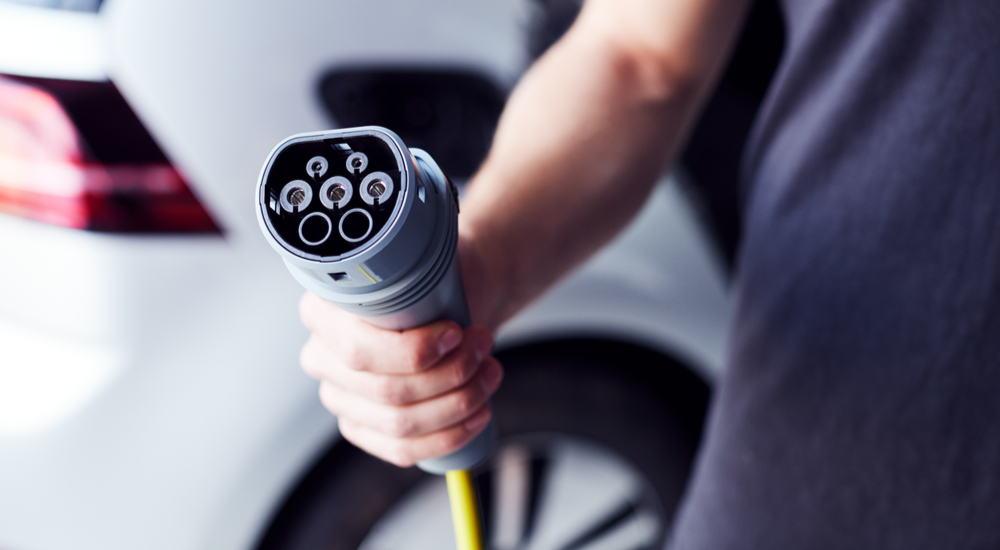
As you can imagine, the standard Five-Cycle test has some issues measuring the efficiency of alternative-fuel vehicles. While traditional hybrids are tested just like any other gasoline-powered vehicle, plug-in hybrid electric vehicles (PHEV) and battery electric vehicles (EV) have their own testing criteria. The results of these electrified vehicles include a rating in “MPGe” or Miles Per Gallon Equivalent. This fictional unit of measure is based on the amount of energy contained in a gallon of gasoline – roughly 33.7 kWh. The amount of electricity consumed during the test is then converted into the equivalent amount of gasoline.
However, since the EPA can’t calculate electricity usage based on tailpipe emissions, a different method was needed. This is why PHEV and EV models have their own unique testing procedure that measures both efficiency and battery range.
EV Testing
The first EV testing standard was written in 1993 and was a simple adaptation of the standard EPA tests. The EV would be fully charged, parked overnight, and then driven on the normal City cycle until the battery is depleted. After the testing is done, the battery is recharged to full, and the amount of energy required is divided by the total miles driven to determine the MPGe rating. The process would then be repeated on the Highway cycle. Interestingly, this method actually takes into account any energy lost in the charging process.
In 2012, the EV test was changed to a multi-cycle test. Rather than conducting separate city and highway tests, the EV is put through back-to-back City, Highway, and Steady-State cycles until the battery is depleted, determining the total range. Separate city and highway MPGe ratings are then calculated mathematically from the results. However, those figures are not what you will see when you look at the window sticker. While the manufacturer has four different options to calculate the official MPGe ratings (including using a mathematical model of the Five-Cycle test or adjusting based on real-world data), the majority simply choose to multiply the test results by 0.7. This means that EV efficiency figures are generally less scientific than those for gasoline vehicles.
PHEV Testing
Plug-in hybrids are the most complicated type of vehicle to test because they have two completely separate powertrains: electric and gasoline. Because the EPA tests the two powertrains separately, the window sticker for a PHEV is particularly deceptive. The big MPGe rating that jumps out at you only covers the efficiency of the electric powertrain, which is tested exactly like an EV without any use of the gasoline engine. The gasoline portion of the powertrain is then tested separately on the standard Five-Cycle test, giving the combined MPG figure.
There is no attempt to measure the real-world efficiency of a plug-in hybrid using both the gasoline and electric portions of its powertrain together as designed. This means that while fuel economy ratings for these vehicles can give you a general idea of how well they stack up against one another, they are nearly useless for comparing the fuel consumption that you can expect from PHEV over a traditional hybrid or conventional gasoline vehicle. In fact, many PHEVs are listed as having inferior combined MPG to their traditional hybrid counterparts because the combined MPG rating takes no account of the electric drive modes of the PHEV. However, this is very difficult to test properly as the efficiency of a PHEV will depend heavily on the distances you drive and how often you recharge.
Fuel Economy Ratings – Imperfect but Important
While there are many flaws and loopholes in the current EPA fuel economy ratings, this testing remains a critical piece of information to car buyers across the country. Without standardized testing by a national entity, we would have little ability to shop for a car that can save us money at the gas pump. However, to get the most out of any information, you have to understand what the numbers you see actually mean and how well they reflect your intended use. Understanding fuel economy ratings means that you can be a more informed consumer and will be better able to predict how the numbers on the sticker will be reflected in your driving habits. This is especially true if you are shopping for an electrified vehicle like an EV or PHEV.


